
Text mining, big data, etc. have been buzz words for a long time now, and the story of “predicting stock prices from twitter” that has been talked about for several years seems to have already become a business.
Social Market Analytics http://www.socialmarketanalytics.com/
The site itself is pretty cool and good.
Recently, they have started to cooperate with the New York Stock Exchange.
The paper that started it all
This service, or rather, the origin of this topic, is
This paper was published in arXiv. I think it was introduced in some media at that time.
By the way, I highly recommend this site for detailed explanations in Japanese.
SMAの概要:S-Factors™
Let me tell you briefly what it does.
「マーケットに関係するtwitterの投稿を分析し感情=sentimentに関わる情報を引き出し、それをスコア化する」
そのスコアを総称して「S-Factors™」と呼んでいます。
S-Factors™の構成要素
S-Factors™は以下のいくつかの要素で構成されていて、
- S-Score™: 観測期間における「感情」を数値化・標準化したもの
- S-Mean™: 観測期間におけるS-Score™の加重平均したもの
- S-Delta™: 観測期間におけるS-Score™ の変化率
- S-Volatility™: 観測期間における感情レベルのボラティリティ
- S-Volume™: ある観測時点におけるS-Factors™ に寄与・関係するツイートの量を計測したもの
- S-Buzz™: 異常時のツイート数を計測したもの
- S-Dispersion™: S-Score™算出に寄与したツイートのソースを計測したもの
(出所:S-Factors Applications Guide(pdf)よりyuu-koma.jpが意訳)
これらを総称して「S-Factors™」といっているようです。
一般に、このS-Score™がプラスであればあるほど、マーケットや銘柄に対して「ポジティブ」「好意的」な感情をもっていることを示し、逆にマイナスであればあるほどマーケットや銘柄に対して「ネガティブ」「否定的」な感情をもっていることを示すとのことです。
And we think that this “emotion” toward the market may affect the stock price.
You can register for a free account
Anyone can easily register for an account with this service and receive the Daily Newsletter, which provides a daily summary of the top and bottom scoring stocks, for free.

Detailed reports, customized reports, and data feeds seem to be paid for. Corporations, financial institutions and funds are likely to be the customers when it comes to data feed services.
Examples of actual service content
Let’s see what’s actually inside, based on the screenshot of its very user-friendly website.
ここでは、2013年2月におけるApple(http://www.socialmarketanalytics.com/graph/stock/AAPL)を例にしてみましょう。

In the upper row, there are three charts. Two of them are S-Mean (green) and S-Score (red) in S-factor. To recap, the S-Score was the score value of the spot, and the S-Mean was the moving average of the two.
The key point is that both S-factors are “Pre-Open”. This means that the numbers are before the market opens.
In other words, the S-factor is used as a leading indicator to see how the emotional state before the market starts affects the stock price after the market starts.
And the third remaining blue chart is the stock price, the closing price for the day.
At a glance, S-factor and stock price seem to be somewhat linked. The green S-mean seems to be more linked than the spot value S-Score.
You don’t seem to necessarily have predictive powers.
しかし、必ずしも予測力があるかというとそうでもなさそうです。 Google(http://www.socialmarketanalytics.com/graph/stock/GOOG)を見てみますと、
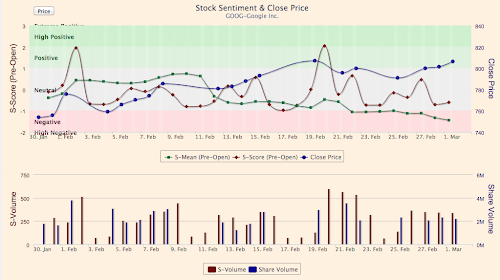
Since 2/21, the stock price has been recovering despite the fact that it was entering rather negative territory as far as S-Mean is concerned.
Naturally, it is not a panacea, isn’t it? The accuracy of the model is bad, or in the first place, the fact that people’s feelings are honestly reflected in the market itself is not a panacea, and there may be various ideas.
By the way, in the above example, we saw the daily state in the last month, but you can also see the intra-day movement. This is also very interesting, so please check the website.
A statistical test of predictive power
You can check the actual forecasting power in the following report on the same site.
SMA Sentiment and 24hr Price Changes http://www.socialmarketanalytics.com/content/sentiment_and_24hr_price_changes
According to this report, there is a significant relationship between the overnight return (percentage change from the previous day’s closing price to the opening price of the day) and the S-Score before the market starts (Pre-Market-Open).

(出所:http://www.socialmarketanalytics.com/content/sentiment_and_24hr_price_changesよりyuu-koma.jpが加工)
The results for the percentage change from the opening price of the day to the closing price of the day were also reasonably significant for stocks with stock prices above $5. However, its effect seems to be smaller than that of the overnight one.
Finally.
So, that’s it for now, I’ve introduced you to one site that takes advantage of this new social media.
Naturally, this kind of service and business has not been fully developed in Japan, and even in the United States, it has just started. I feel that we are living in an interesting time.
I’ve always had a strong interest in this kind of topic, but I’m also paying close attention to future developments because I need to break new ground in my work.
It would be ideal if I could connect it to my work in a good way, though.
Misako Takayasu

日本評論社 2012-08-24
Sales Ranking : 184942