I will continue to look at the blog statistics of this year as a summary of 2012. (Here are the stats from Google Analytics.
In this article, I’d like to look at “page views by visit and time spent” with the aim of capturing aspects that simple quantitative statistics (number of visits and page views) don’t reveal.
“It may be an exaggeration to say that it looks at the “quality” of blog access, but the results are very interesting and typical of this blog.
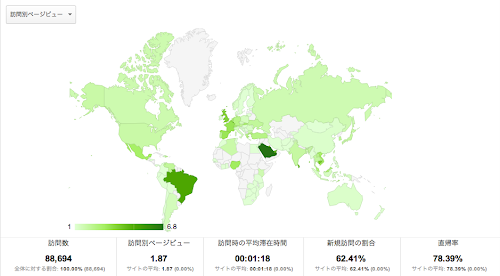
- The number of visits by country/region other than Japan is still high in Europe.
- Once they start looking, they tend to stay longer and visit more pages
- Next year I want to focus on the number of visits “by number of repeat visits”.
- Interpreting access analysis is a very good number interpretation exercise
The number of visits by country/region other than Japan is still high in Europe.
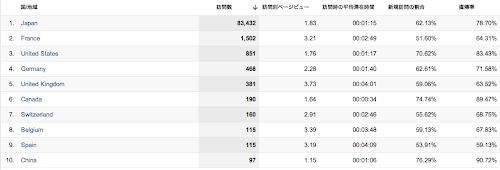
Since our blog is in Japanese, most of the visitors are from Japan, but among the countries/regions other than Japan, the number of visits from France was the highest at 1,502.
間違いなく2012年も「フランスの最も美しい村巡り」による投稿が多かった影響でしょう。おそらく現地のお住まいの日本人の方に多く読まれたのだと思います。
In France, as well as in other European countries such as Germany, the United Kingdom, Switzerland, Belgium and Spain, the following characteristics are particularly evident
- 訪問別ページビュー数が比較的大きい
- 訪問時の平均滞在時間が比較的長い
- 直帰率が比較的低い
I think this data also tells us that there is a lot of “European talk”.
Once they start looking, they tend to stay longer and visit more pages
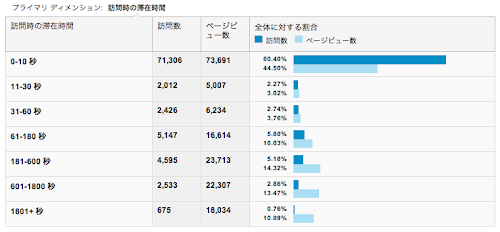
Statistics such as the number of visits and the number of page views by the duration of the visit or by the number of pages visited also show the nature of this blog.
First, the number of visits and pageviews “by time spent on visit” is relatively high, except for 0-10 seconds, where 61-180 seconds and 181-600 seconds are relatively high.
And the number of visits and page views “by number of pages visited”
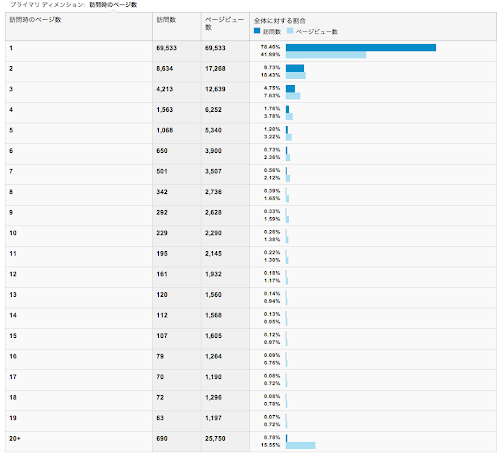
In terms of the number of visits, “Page 1” accounts for nearly 80% of the total, followed by “Page 2” and “Page 3”. It can be said that these results are in order, but what should be noted is that
「20+(20ページ以上)」が全体の4番目に多い
That’s what I mean.
This means that while most visits come from some kind of search site and disappear in an instant, many visitors stay for a long time and visit various pages once they are interested.
Next year I want to focus on the number of visits “by number of repeat visits”.
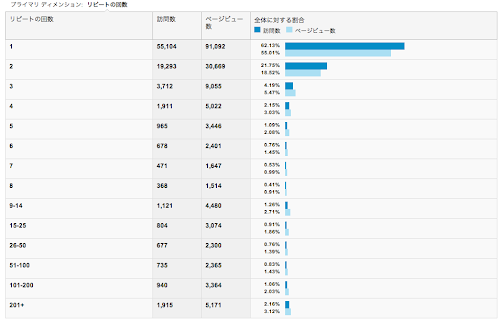
The number of visits by number of repeats also shows interesting results. Of course, the number of repeat visits (1), or new visits, is the highest, but the number of repeat visits (200+) is in fourth place at 2.16% of the total.
This is the most pleasing result because it can be said that the number corresponds to the quota of so-called “regulars” or “people who always visit us every time we update.
We would like to continue our activities so that these “regulars” will continue to visit us next year and beyond.
Interpreting access analysis is a very good number interpretation exercise
Although the number of accesses itself is very small because it is not for commercial use but just a personal blog, the objective analysis by Google Anallytics will be a reference for the management policy of the blog after next year.
Furthermore, although it is only a hobby, it is also a good opportunity to train how to interpret numbers through such play.
At the same time, you can also learn about web business.
というわけで、来年以降も引き続き、ダラダラな内容、とりとめもないプライベートな日記を続けていきたいと思います。